
Debugging embedded applications with Real Time Transfer (RTT) and EK-RA6M4 board
Overview
Usually when debugging embedded systems, the most difficult thing is to get information out from the system without affecting the performance or the timings of the executing embedded application. With Segger's Real Time Transfer (RTT) technology, it is possible to debug embedded systems using high performance communication channels without affecting the real time behavior of the system. RTT can be used with any J-link debugger model and it combines the advantages of Serial Wire Output and semihosting. Supported target processor, like Cortex-M processors we have in Ek-RA6M4 board, must allow background memory access. This blog will show you how I used RTT with the Renesas EK-RA6M4 board and e2 studio.
RTT details
RTT supports multiple communication channels to both directions which makes it also possible to input data to the application. User can specify the amount of different channels used during compile time. RTT will use these channels to communicate with the application on the host side. There are applications like RTT Viewer, RTT Client or RTT Logger. You may also write your own custom application by using J-link Software Development Kit.
RTT uses Control Block data structure to define a structure for all communication channels. This data structure, implemented in the target RAM memory, will contain data buffer and state information for each channel. There is also an ID which is used by tools like RTT Viewer to search for Control Block data structure from target memory automatically. If this automation doesn't work correctly and data structure cannot be found, user can define the memory address for it in the host application. RTT can be used without any additional configuration assuming Control Block can be found.
Why is RTT so fast? Its because that embedded application can write data directly to RAM memory instead of sending data out from the system and accessing RAM memory is really fast. Meanwhile, J-link debugger can access that memory on the background and send that data to host application without intervening embedded application execution.
Hardware setup
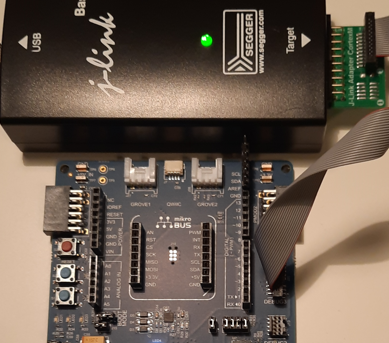
I referred to the chapter 5.2.2 in EK-RA6M4 User's Manual for jumper configuration to select debug in mode. This mode allowed me to use external J-link Base debugger. The only change I needed to do, compared to the default configuration, was to close jumper J9. After this, I connected my J-link Base to 20-pin connector and powered the board using debug USB port.
Software setup
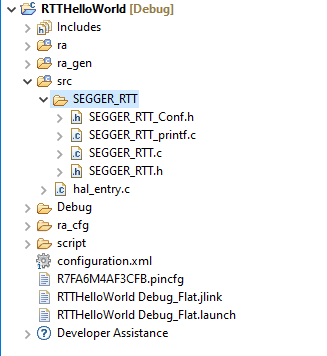
I downloaded and installed J-link software and documentation pack from Segger website. With this package, you will get necessary J-link drivers for the debugger and RTT source code for your own projects. In e2 studio, I created a default blinky application without RTOS to be used with my RTT test. J-link installation folder includes an example code for the RTT in Samples\RTT. I extracted that compressed file to my e2 studio project src/SEGGER_RTT folder. I moved the following files under src/SEGGER_RTT and deleted rest of the files:
- SEGGER_RTT_Conf.h
- SEGGER_RTT.c
- SEGGER_RTT.h
- SEGGER_RTT_printf.c
After this, I needed to fix the line including configuration file in SEGGER_RTT.h file to search configuration file from the correct path. Resulting project looked like this.
Implementation
The following changes were added to the hal_entry.c file to test the RTT. First, I included the header file and then called a function to configure RTT to a specific mode. Then couple of print calls were added to print something to the host application terminal.
Finally, I just built the project and started a new debug session.
Testing
While having the debug session running, I started RTTViewer application. I selected to connect to existing session with Auto detection for the Control Block. Finally I clicked OK and application printed connected status for me.

For some reason, I wasn't able to see any of those debug prints in the RTTViewer. After having a look at the J-link Web control panel with web browser, it was obvious that Control Block address was not found and debugger was constantly scanning for it.

I wasn't sure why the Control Block wasn't found nor how to fix this problem. I restarted RTTViewer and selected to reconnect existing connection with the address range specifying where to search the Control Block from. I selected to start from the beginning of the RAM address range:

After this, Control Block was found and I was able to see my debug prints on the terminal.

Virtual terminals
There can be plenty of debug messages and some important ones might be lost to the noice. If I want to separate normal output messages from the error messages, it can be done by using virtual terminals. With virtual terminals, user can print data to multiple windows (or tabs). I added two functions to my code, first to switch the terminal and then to print decorated data to the selected virtual terminal (to mimic stdout and stderr). Error messages are printed with red and output messages with black background:
Now I can see my output messages in terminal 1 and error messages in terminal 2. You can see from the following image that the color is not so important anymore when those messages are printed to the separate tabs.

Getting the Control Block address
As noticed, there might be a need to know the address of the Control Block in RAM memory. One way is to check the address of Control Block when running the debug session. Another is to check where the _SEGGER_RTT is linked in memory by reading the Executable and Linkable Format file. For example, in my project using readelf binary in Cygwin, I get:
Thus, I could specify address 0x20000044 directly to the RTTViewer and it should work. The best option might be to assign a new memory section for the Control Block and link data structure there. This way you would always know where it will located.
J-link command strings
When using other applications than RTTViewer and you have a need to manually set Control Block address, it can be done using J-link Command Strings and J-link Commander. To set specific address, you can use SetRTTAddr command string:
Conclusion
RTT is really easy to use as it doesn't require any additional configuration. It as also much better method to get debug strings out from the embedded system compared to sending characters with UART or other serial interfaces. Of course, you need to have an access to the JTAG pins of microcontroller. I didn't do any performance benchmarking, you may read Segger web site for some measurements. In any case, RTT is definitely something I will start using on my daily work when possible.